
NBA Back-to-Back ATS Patterns: A Two-Decade Data Set Re-Examined
 Available in US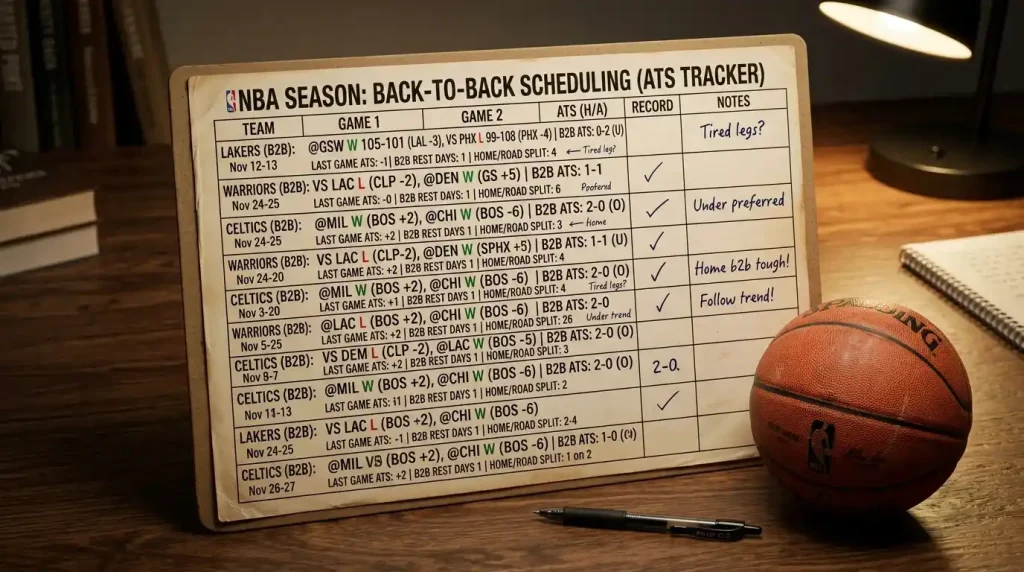
The 4,176-Game Number That Stopped Me Arguing
A mate once told me, with full confidence, that fading back-to-back teams was the easiest money in basketball. I asked him for the data. He sent me a screenshot of a Twitter thread. So I pulled the actual record going back to 2005, all the way through the 2024-25 season. The total was 4,176 games – and the ATS line was 2058 wins, 2118 losses, 49.3 percent to win straight up, 50.7 percent to cover. The fade angle was not edge. It was variance.
That was the moment I stopped trusting basketball folklore and started building my own back-to-back filters. The numbers are not where the casual punter thinks they are, but they are not random either. The edge sits in subsets, not in the headline.
See also NBA home court advantage for schedule-based edges.
What Counts as a Back-to-Back in 2025-26
A back-to-back in the NBA is a team playing two games on consecutive calendar days. Sounds simple, but the league’s scheduling has changed shape since the player participation policy hit in 2023, and again with the load management restrictions tightening for 2025-26. The frequency is down. The distribution is different. And the second-leg games now mean something slightly different than they did a decade ago.
Most teams now play between 12 and 15 back-to-backs per season, with the schedule office trying to keep that count under 14 where possible. Travel-second-leg-on-the-road back-to-backs – the brutal ones – are deliberately rationed. Home-second-leg back-to-backs are more common. That asymmetry is where the modern ATS edge lives.
The other shift is that load management on the second leg is policed harder. The participation policy means star sit-outs require league documentation. Coaches still rest players strategically on the second leg, but the wholesale “we are out tonight” approach of the late 2010s is largely gone. UK books have adjusted their lines for this – the question is whether the adjustment is enough.
The Twenty-Year Record Broken Down by Subset
Let me give you the picture without the noise. From 2005 through 2024-25, NBA teams in back-to-back situations went 2058-2118 ATS overall. Roughly coinflip. The 95 percent confidence interval on that includes pure randomness – there is no overall back-to-back ATS edge to be mined from the raw data.
Now the subset that matters. Home teams on the second leg of a back-to-back went 636-730 ATS. That is 46.6 percent – already worse than coin flip. Apply a public-betting filter on top: home back-to-back teams receiving 65 percent or more of the betting handle, and the record collapses to 84-200 against the spread. That is a 58 percent fade ROI on a clearly defined subset – the closest thing to a structural edge the back-to-back data has ever produced.
What is going on? The home crowd makes the public love the home team. The fatigue is real but invisible on TV. The line shading reflects the public bias, not the underlying performance. When the public piles in heavily on a tired home favourite, the closing line shifts further than the true win probability – and the value flips to the road dog.
Road Back-to-Backs and the Modern Schedule
Road back-to-backs are the case the folklore actually got mostly right. Teams playing the second leg on the road, away from home rest, against a fresher opponent, struggle. The straight-up win rate is roughly 41 percent. The ATS line is closer to 47 percent – better than the straight-up number because UK books and US books both shade lines toward the road dog already.
The trap is that the public knows this. So the shading has gone deep. Backing a road-second-leg team blind is not the play. The play is identifying the road-second-leg games where the shading has gone too deep. Look for road second legs against a weak home team with a losing home record. The handicap often gives you four to six points when the true gap is two or three.
League pace context matters here too. Last season’s overall pace was 99.4 possessions per 48 minutes. Teams that play below that – Boston at 96.45 was the slowest – see less variance in their back-to-back numbers because fewer possessions means less room for fatigue to compound. Fast teams in back-to-backs swing wider. Both directions.
The Load Management Era and What It Did to the Numbers
The participation policy that arrived in 2023 was designed to stop teams from resting healthy stars on the second leg of back-to-backs in national TV games. It mostly worked. The percentage of star sit-outs on second-leg national TV games dropped sharply. The percentage of star sit-outs on second-leg non-national-TV games dropped less.
That distinction is now a betting input. If a contender’s second leg is a Tuesday game on League Pass with no national broadcast, the resting probability is higher than the same team’s second leg on a Sky Sports Wednesday. The UK punter watching at midnight has less information about who is actually playing than the punter watching the Wednesday national game. The lines do not always reflect that information asymmetry.
My rule of thumb for the 2025-26 schedule is simple. Star resting on second leg of a back-to-back: roughly 12 percent likelihood for national TV games, roughly 22 percent for non-national. Use that probability when you are weighing line value. A 22 percent chance the franchise player sits is material – even at decent UK pricing, the line moves about a point and a half when a star is downgraded.
Where the Public Still Falls for the B2B Fade
The “fade the back-to-back” trade is the most popular fake edge in basketball betting. It has been popular for two decades, the books know it, the lines are priced for it, and the headline data does not support it. The 2058-2118 overall record is the proof – if fading worked at the macro level, the books would not survive offering the angle.
What does survive is the specific case I described above: home-second-leg favourites with heavy public action, faded back. That is not a casual angle. That is a filtered, disciplined trade that needs sharp public-money data to execute. It is also the single most consistent back-to-back edge available in 2025-26.
The other ongoing reality is that team totals – the over-under on a single team’s score – respond to back-to-back fatigue more cleanly than the spread. Tired teams shoot less efficiently, and shooting efficiency drops in the 90 to 100 pace range that closer games funnel into. If you want to bet back-to-back fatigue, betting the team Under often pays better than betting the opposing spread.
The B2B Angle I Use Three Times a Week
My working method on back-to-back games is to run them through three filters before placing anything. First, identify whether it is a home or road second leg. Second, check the public handle percentage at one of the UK books that displays it. Third, look at the rest disparity – is the opponent on equivalent rest or fresher.
If the answer is home second leg, 65 percent or more public on the favourite, opponent fresher: fade is on the table. Anything else, I move on. There are usually two to four games per week that hit all three. Some weeks zero. The discipline is in not creating the angle when it is not there.
This pairs naturally with the broader load management piece – the rest-day economy is at the centre of both. If you want to go deeper on how the policy reshapes scheduling-related markets, the breakdown of the player participation policy and UK lines covers the second-order effects on team totals and player props that the back-to-back data alone does not show.
The casual punter sees the back-to-back tag and reaches for the fade. The disciplined punter sees the back-to-back tag and asks three questions. The data has not changed in twenty years, and neither has the answer.
The structural edge - home-second-leg favourites with 65 percent or more public handle - is still showing roughly 58 percent ROI through the 2024-25 sample. The load management policy reduces star sit-outs on the second leg, which actually strengthens the fade because the public bets the home team assuming the star plays, but the home team is still genuinely fatigued. The mechanism behind the edge is public bias, not star absence, so the policy does not undermine it. Tired teams shoot less efficiently, and back-to-back second-leg teams score roughly two to three fewer points than their season average. The team total Under on the back-to-back team is one of the cleanest applications of fatigue data. It works particularly well in games where the opponent plays slow-paced basketball - the pace constraint limits the tired team's chances to make up the efficiency gap with volume.Frequently Asked Questions
Does the home back-to-back fade still work under the 2025-26 load management rules?
How does a back-to-back affect the team total Under bet?
