
The NBA Player Participation Policy and What It Did to UK Betting Lines
 Available in US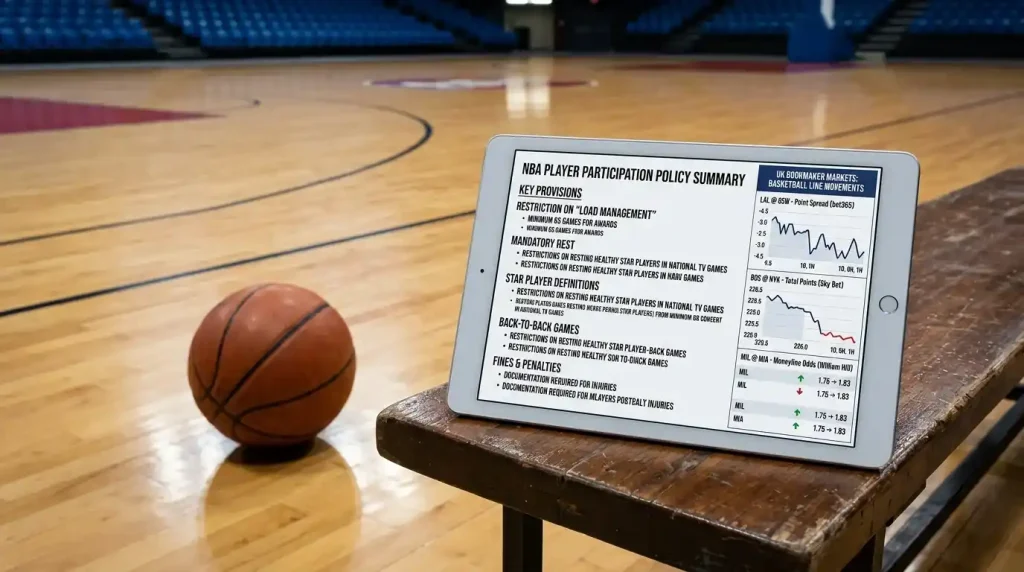
The Wednesday in October That Made Me Rebuild My Model
October 2023. The NBA’s player participation policy went live. By the Wednesday after the announcement, the lines on national TV games had shifted in ways that did not match any of my historical models. Star players I had pencilled in as 50-50 for back-to-back rest were now near-certain to play. Spread movement on big-market matchups was different. My pre-season projections were already obsolete and we were two weeks into the season.
The participation policy rebuilt the second-half-of-season pricing logic that UK NBA betting had relied on for a decade. The 2025-26 season is the third year under the rules, and the dust has settled enough that the new equilibrium is clear. The pricing landscape is not the one most UK punters carry in their heads from the late-2010s era.
See also NBA injury report workflow for pre-game checks.
What the Policy Actually Requires
The participation policy mandates that healthy stars must play in nationally televised games and in-season tournament matches. Stars are defined by recent All-Star selections, All-NBA team membership, or comparable performance markers. Teams that rest a healthy star in a national TV game face fines starting at $100,000 for a first offence and escalating sharply for repeat violations.
The rule does not eliminate strategic rest entirely. Teams can still rest stars on non-national-TV games. They can rest stars when injuries provide legitimate cover. They can rest stars on the second leg of back-to-backs in specific circumstances, with league pre-approval. The structure permits load management to continue – it just removes the most visible category, the marquee national broadcast, where star absences damaged the league’s media product most.
The enforcement has been credible. Multiple teams have been fined under the policy since its introduction. The deterrent works as intended – coaches and front offices are visibly more careful about which games stars sit. The marquee Sky Sports and Prime Video games in the UK schedule are now reliably star-stocked in a way they were not five years ago.
The Before-and-After Picture in Numbers
Pre-policy, star sit-out rates on second legs of back-to-backs ran around 22 percent league-wide. National TV games had marginally lower sit-out rates because of the existing reputational pressure, but the rate was still meaningful at around 18 percent. Post-policy, the national TV sit-out rate has dropped to under 5 percent on second legs of back-to-backs. The non-national-TV rate has stayed closer to 22 percent – the policy has redistributed rest rather than eliminating it.
The pace data tells a similar story. League pace held at 99.4 possessions per 48 minutes in 2024-25, with team-specific pace ranging from Boston at 96.45 to faster squads above 102. Pre-policy, the pace projection for a star-rested game was 2 to 3 possessions lower than the team’s season average. Post-policy, that effect is concentrated in non-national-TV games, where the rest activity has not changed much.
The cumulative effect on betting lines is that national TV games now price more like the team’s season-average baseline. Non-national-TV games – particularly Tuesday and Wednesday slate games on League Pass – price with more uncertainty than before, because the strategic rest activity that used to be spread across the schedule is now concentrated in this segment.
What “National TV” Means for the Policy
The policy’s definition of national TV is specific. Games broadcast on the US national networks – ESPN, ABC, TNT in legacy terms – count fully. Games on local regional sports networks do not. The implication for the UK punter is that Sky Sports and Prime Video broadcasts are not the binding factor – the US national broadcast status is what matters for the policy.
This is a subtle but consequential point. A Wednesday game on Sky Sports UK might be a regional broadcast in the US, which means the policy does not protect it. The same game on Prime Video UK might also be regional in the US. The UK broadcast status creates the impression of a marquee game, but the policy’s protection is contingent on the US-side classification.
The practical effect is that UK punters cannot use Sky Sports or Prime Video coverage as a guarantee of star availability. The schedule needs to be cross-referenced with US national broadcast schedules to determine whether the policy applies. The major beat reporters publish this information, and the aggregators flag policy-protected games, but the casual UK punter often does not check.
How Back-to-Back Rest Shifted
The pre-policy back-to-back rest pattern was largely uniform across the schedule. The 22 percent star sit-out rate on second legs applied roughly evenly to national TV and non-national-TV games. The policy has bifurcated this. Second legs on national TV games now run under 5 percent star sit-out rates. Second legs on non-national-TV games run around 22 percent – essentially unchanged from the pre-policy era.
The implication for the back-to-back betting workflow is significant. The historical analysis of back-to-back ATS patterns – the 4,176-game sample showing 49.3 percent straight up and 50.7 percent ATS – was built on pre-policy data. The post-policy data set is smaller, but the early signal is that the home-second-leg fade angle still works in the relevant subset because the public bias driving the angle is independent of star availability.
The road-second-leg angle has compressed in national TV games because star availability is more reliable, which means the line shading reflects sharper expectation. The same angle on non-national-TV games still carries the historical edge because rest activity has not changed meaningfully there. The discipline is in separating national from non-national when applying back-to-back analysis.
Props, Pace and the Policy Fallout
The most visible effect of the policy on prop markets is on national TV games. Star scoring props on Sky Sports and Prime Video marquee matchups now price more confidently because the player is more reliably on the court. The lines are tighter – the margin between over and under has compressed because the expected outcome distribution is narrower.
Non-national-TV games show the opposite pattern. Star prop lines on Tuesday and Wednesday non-marquee games carry more variance because the resting probability is meaningful. UK books typically price these markets with wider spreads to compensate. The punter with a clear read on which non-national-TV games are likely rest candidates has an information edge that the books are pricing for but not always pricing accurately.
Team total lines reflect the same pattern. National TV games price closer to season-average team totals. Non-national-TV games price with more cushion, because the bookmaker is accounting for the possibility of strategic rest reducing team scoring. The Over leans on national TV games are slightly stronger post-policy because the expected outcome is now closer to the season-average baseline that the line is built on.
The Schedule Filter I Now Apply to Every Bet
The first question I ask before any NBA bet is whether the game has US national broadcast protection. If yes, I treat the star availability as a high-confidence assumption and price the bet accordingly. If no, I add a probability layer on star availability, weighting both teams’ likely rest decisions based on the day of the week, the team’s playoff seeding, and the opponent’s profile.
The second filter is whether the game falls on the second leg of a back-to-back. Combined with the broadcast status, this gives me a four-cell matrix. National TV plus first leg of back-to-back: highest confidence on star availability. National TV plus second leg: high confidence because of the policy. Non-national-TV plus first leg: moderate confidence, standard rest discipline applies. Non-national-TV plus second leg: lowest confidence, this is where the resting risk concentrates.
The fourth cell is where the most careful work has to be done. A non-national-TV game on the second leg of a back-to-back, for a contending team with playoff seeding largely secured, is the highest probability rest scenario in the modern NBA. The lines on these games typically reflect this, but the cushion varies by book. Shopping prices across UK operators on these specific games returns more value than on any other game category in the post-policy era.
The deeper analysis of how scheduling-specific patterns intersect with the post-policy rest environment is covered in the framework around back-to-back ATS patterns, which shows how the home-second-leg fade has held up despite the policy’s reshaping of the rest landscape.
The participation policy is now a permanent fixture. The lines reflect it. The strategic rest activity has redistributed rather than disappeared. For the UK punter, the workflow has changed – the broadcast status matters more than it ever did, the back-to-back analysis needs national-versus-non-national separation, and the prop markets bifurcate cleanly along the same line. The structural shift is finished. The pricing has adjusted. The edge sits in knowing which side of the policy boundary any given game falls on.
See also nba betting help for the complete NBA betting guide.
No. The policy's protection applies to US national television broadcasts only - the legacy ESPN, ABC, and TNT national windows, plus the Amazon Prime Video national windows in the US. Sky Sports UK and Prime Video UK broadcasts do not trigger the policy's star-availability requirement. The UK broadcast designation is independent of the US classification, so a game on Sky Sports might be a regional broadcast in the US and therefore not policy-protected. UK punters cannot rely on the UK broadcast status as a guarantee of star presence - the US classification is the binding factor. Yes, on national TV games. Team total variance on US national broadcast games has compressed since the policy took effect, because star availability is more reliable and the team's expected scoring profile aligns more closely with season averages. Non-national-TV games show similar or slightly higher variance compared to pre-policy levels, because the strategic rest activity has redistributed to these games rather than disappearing. The bifurcation has been consistent across the three seasons under the policy.Frequently Asked Questions
Does Sky Sports broadcast count as 'national TV' for the participation policy?
Are NBA team totals more stable since load management was restricted?
