
NBA Referee Tendencies and Betting: What the Last Two Minutes Reveal
 Available in US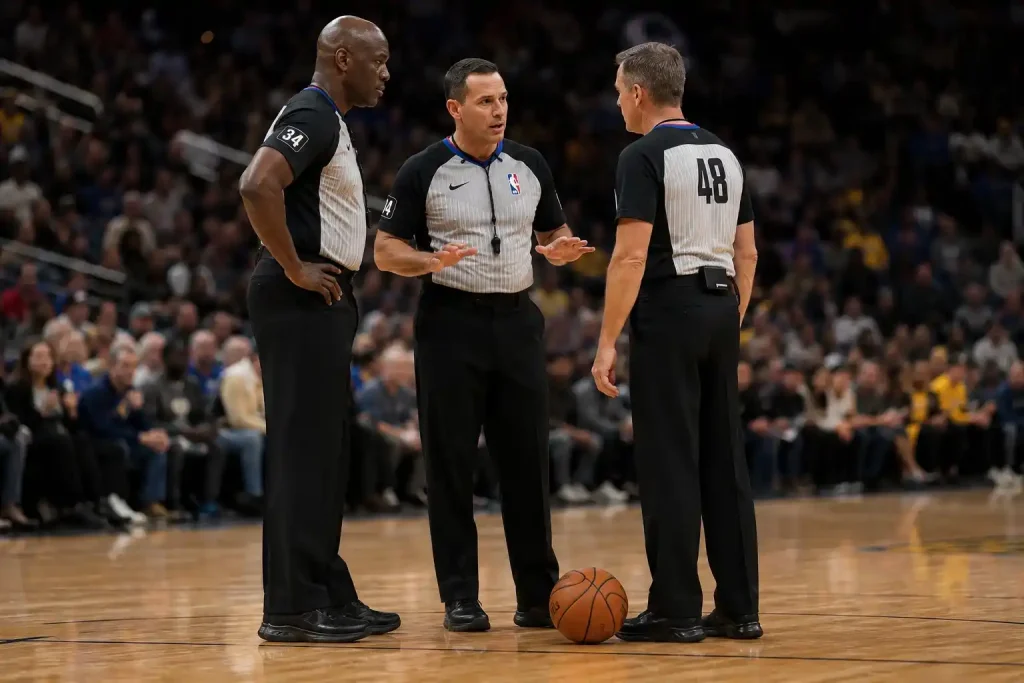
The Crew Assignment I Started Checking Two Hours Before Tip-Off
For most of my early career, I dismissed referee tendencies as folklore. Then in 2022 a colleague who worked in sports analytics showed me a spreadsheet of last-two-minute call accuracy broken down by crew chief. The variance was not random. Certain crews missed calls in directions that correlated with home team and underdog status. The data was sitting there in plain sight, published by the league itself, and I had been ignoring it.
Since then I check the assigned crew for any NBA game I am pricing for more than recreational stakes. The information is publicly available about two hours before tip-off. It moves my view on totals more often than any other single input outside of injury reports.
See also NBA pace and possessions for data-driven angles.
The Last Two Minute Report and Why It Exists
The NBA introduced the Last Two Minute report in 2015 after a series of high-profile officiating controversies. The report grades every officiating decision – calls made and calls not made – in games that are within five points at the two-minute mark of the fourth quarter or any overtime. Each decision is graded as a correct call, incorrect non-call, correct non-call, or incorrect call.
The point of the report is transparency. The unintended consequence is a public dataset that bettors and analysts have mined for nearly a decade now. Every crew, every referee, every call type is graded against a single standard, and the patterns that emerge are the closest thing the NBA offers to a public referee scouting report.
The reports are published two to three days after each game. They cover only the most consequential portion of the game – the closing minutes when calls actually decide outcomes. That focus makes the data noisier on small samples but cleaner on the question that matters: do specific referees miss calls in ways that systematically advantage one type of team over another.
The Belasen 2025 Findings That Changed the Conversation
A research paper published in early 2025 by Belasen and colleagues examined L2M data across multiple seasons and found a measurable bias pattern. Referees made 23 percent fewer wrong calls against visiting underdogs than the league average, and 42 percent fewer wrong calls against home underdogs. The bias direction is consistent – refs are systematically more careful with underdog calls, particularly home underdogs, in the closing minutes.
The mechanism is debated. The most plausible reading is that referees, aware of the L2M report and the public scrutiny of close-game calls, are conservatively avoiding calls that would penalise the team behind. The result is a slight tilt that favours underdogs at the margins – specifically when games are close and the underdog has the ball or is defending a critical possession.
For UK punters, this matters in live betting. The last five minutes of a game within five points, with an underdog still in contention, is a betting window where the underlying call distribution favours the underdog more than the closing line implies. Live spreads on underdogs in close-game endgames have shown small but consistent value across the seasons covered.
Crew Chief Tendencies That Show Up Year After Year
Beyond the league-wide bias, individual crew chiefs have personal tendencies that persist across seasons. Some crews call fouls at significantly higher rates than the league average. Others are notably tight on travelling violations. A handful are consistent toward the higher end on three-second defensive lane violations.
The aggregate effect on betting is that crew assignment shifts the expected total points. A crew that calls 12 percent more fouls than average produces games with 18 to 22 more free throws than league average. At 76 percent average free throw shooting, that is 14 to 17 more points scored. The total points line for a game called by a high-foul-rate crew should sit 4 to 7 points higher than a game called by a low-foul-rate crew, holding teams constant.
UK books factor this into totals lines, but the adjustment is partial. The full crew-specific adjustment is not always made, particularly on midweek non-marquee games where the line is set primarily on team averages. The window where the value sits is the bottom-half of the slate, where the books care less about precision and the punter with crew data has an asymmetric read.
How Crew Tendencies Feed Total Points Bets
The link between crew calling patterns and total points is the cleanest single application of referee data. More fouls equals more free throws. More free throws equals more stoppage time, fewer fastbreaks, and a slightly different pace profile. The net effect on totals is the foul-rate effect dominating – more points scored, slower pace, but the foul effect wins on points.
The league averaged 99.4 possessions per 48 minutes last season, with the slowest team running 96.45 possessions. Within that pace, the foul rate variance across crews is enough to shift a total by 3 to 5 points relative to the line midpoint. That gap is wider than the typical line tightness, which means crew assignment is genuine information that can outweigh the book’s pricing on a meaningful number of games.
The discipline is in not overweighting it. Crew tendencies are real but they are one input among ten. A bet built primarily on crew assignment, with the underlying matchup against the angle, is a bad bet. A bet where the matchup leans the same direction as the crew, and the line has not fully absorbed both, is where the value compounds.
The Integrity Layer the Modern Game Carries
Sportradar’s monitoring system flagged 233 suspicious basketball matches in 2025. Football flagged 618. The basketball figure is global and includes EuroLeague and NCAA, not just NBA, but the trend is upward. Most of those flags do not involve referees – the prop bet investigations involving players like Jontay Porter are far more common than referee-related flags. But the integrity infrastructure now scrutinises every layer of the game.
The 2024-25 NBA prop-wager investigations included multiple cases that resulted in disciplinary action. The Porter case in particular became a watershed for how UK books treat prop markets on niche players. The league’s response has been to tighten access to officiating data, formalise referee assignment publication times, and increase fines for teams that publicly criticise officials in a way that could move betting markets.
For the UK punter, the integrity environment means the referee data you see is more reliable than it was five years ago. The crew assignments are confirmed earlier. The L2M reports are released on tighter schedules. The line manipulation around officiating crews is harder for bad actors to execute because the audit trail is now comprehensive. The whole ecosystem has tightened – that is good for the disciplined bettor, less good for anyone trying to exploit information asymmetries that no longer exist.
The Crew Check That Fits Into a Two-Minute Pre-Bet Routine
My pre-bet check on referees is short. Pull the assigned crew chief from the league’s pre-game release. Cross-reference against the crew’s foul-rate index for the season. If the index is in the top quintile, adjust my expected total upward by 4 points. Bottom quintile, downward by 4 points. Then look at where the book’s line sits relative to my adjusted total.
If the book has already priced the crew adjustment in – which I can read from the line being 2 to 3 points above or below where the team season averages would put it – I move on. The bet is over. If the book has not adjusted, the value is on the side my crew read suggests. Most games, the books have done the work. A handful per week, they have not.
The harder discipline is on prop markets. Crew tendencies affect player free throw attempts more than any other prop. A high-foul-rate crew assignment lifts the free throw attempt projection for the team’s leading scorer by 1 to 2 attempts. That is enough to flip the over-under on free throw makes for any player whose line is sitting near the median. The same crew check that informs totals informs free throw props in the same direction.
Referee data is one piece of the broader integrity-and-information picture, and the prop monitoring infrastructure is the more consequential part of the picture for most UK punters. The full breakdown of prop integrity and the Porter case covers the regulatory side of how the league now handles the same kind of data that surfaces these officiating patterns.
The L2M report has been public for nearly a decade. The crew tendencies have been mined by analytics shops for almost as long. The edge has narrowed but it has not disappeared – and the two-minute pre-bet check costs less than a coffee and pays out over a season.
See also nba betting help for the complete NBA betting guide.
The reports are released on the NBA's official media site, typically two to three days after the game they cover. They are public, searchable by date and game, and free to access. The format is a table of every call and non-call in the final two minutes of any game within five points at the two-minute mark, with each decision graded as correct or incorrect by the league's officiating review committee. Aggregators compile crew-level summaries from these reports for season-long tendency tracking. Without naming individuals, the foul-rate distribution across crew chiefs in the current season ranges from about 38 fouls per 48 minutes on the high end to 32 on the low end. The crews in the top quintile produce games that finish 4 to 7 points above team season-average totals, which translates into a measurable Over lean when the assignment is one of those crews. The league does not formally rotate crews to balance these tendencies, so the bias persists across games.Frequently Asked Questions
Where does the NBA publish the Last Two Minute report?
Has any specific crew chief shown an Over bias in 2025-26?
