
NBA Pace and Possessions for UK Bettors: From 99.4 League Average to Game-Specific Edges
 Available in US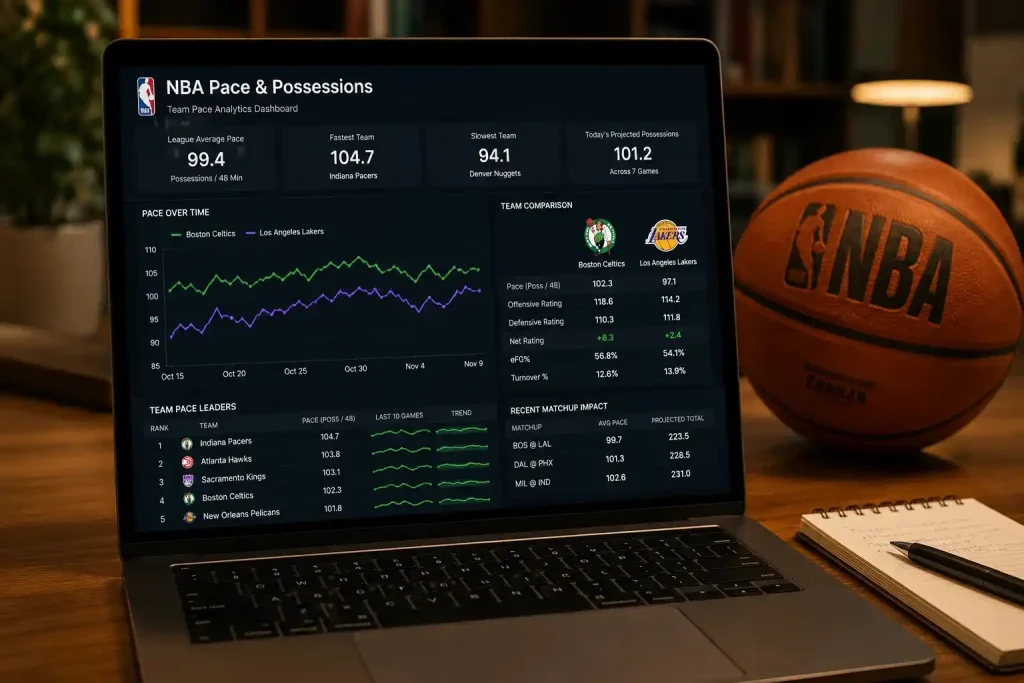
The Hidden Variable Behind Every NBA Total
A reader emailed me last December insisting that NBA totals were a coin-flip – he’d backed 47% across 240 plays and was ready to quit basketball. I asked him one question: do you check pace before you click? He didn’t know what I meant. Six months later, after we’d worked through possessions per 48 minutes and team-by-team pace tendencies, his hit rate was running at 53.5%. The market hadn’t changed. His read of the market had.
Pace is the single most-undervalued analytical input among British NBA punters. It’s the spine of every game total, every player prop, and most spread movements. The bookmaker’s model is built around pace estimates; the recreational punter’s model rarely is. That gap is one of the cleanest persistent edges on the UK NBA slate.
What I want to do here is unpack pace from the ground up. The definition, the league baseline, the team extremes, the matchup interaction effects, and the three-point relationship that’s been quietly reshaping the entire pace-versus-total landscape for two decades. By the end, you should be able to look at any NBA game and produce a within-5% estimate of the expected total just from pace, without consulting any other model.
See also NBA three-point volume betting for pace-related markets.
What Pace Actually Measures
Pace in the NBA is possessions per 48 minutes. A possession is the period during which one team has the ball before either scoring, missing a shot grabbed by the opponent, turning the ball over, or having shooting fouls drawn that end the possession in free throws. Each team gets roughly the same number of possessions per game because the ball alternates.
The league-wide pace for the 2024-25 regular season landed at approximately 99.4 possessions per 48 minutes. That number anchors every total on the board. If you take 99.4 possessions, multiply by the league-average points per possession (around 1.13 for 2024-25), you get an expected total of roughly 224 points per game. Books typically open totals between 215 and 240 depending on the specific matchup, with the bulk clustering 220-230.
Pace is not the same as “fast-paced” in the colloquial sense. A team can play physical, defensive basketball at high pace if they push transition off rebounds. A team can play “exciting” offensive basketball at low pace if they run methodical half-court sets. The metric measures structural possession rate, not stylistic energy. Memphis and Indiana play fast not because they “want to score” – they play fast because they rebound and push.
One nuance worth internalising: end-of-quarter intentional fouling distorts pace measurement slightly. A team intentionally fouling in the last 30 seconds of a quarter to stop the clock is artificially increasing possession count without adding game flow. Most pace estimates exclude these end-of-quarter strategic possessions, but raw pace numbers on some data feeds include them, which inflates the figure by 1-2 possessions per game. Check your data source.
The 2024-25 League Baseline
Memorising 99.4 as the league baseline is the single best investment of memory you can make in NBA totals analysis. It’s the anchor against which every team’s pace and every matchup’s expected pace gets calibrated.
The 99.4 number isn’t constant year to year, but it’s stable. League pace has hovered between 98 and 101 possessions since the 2019-20 season, after a steady climb from the low-90s through the early 2010s. The post-COVID era has settled into a tight band, with rule changes (faster shot clock resets, fewer continuation calls) doing most of the upward push and load management doing the corresponding downward pull on regular-season pace.
Where the league baseline matters most: as a sanity check on the bookmaker’s total. If a game is priced at 234 total and both teams play 100-pace basketball, that’s 17 points above the matchup’s expected combined score at league-average efficiency. The bookmaker is implying either elevated efficiency (something about defence being below par) or pace expectations above 100 (something about transition opportunity). Knowing which signal to attribute is the work.
The opposite holds: a 215 total in a 100-pace matchup implies depressed efficiency. That’s usually defensive matchup quality – two top-tier defensive teams projecting low points per possession. The total is the book’s combined estimate of pace and efficiency. Strip out pace, and you can sanity-check efficiency.
Team Pace Extremes and Where They Sit
Across the 2024-25 NBA season, team pace ranged roughly 96 to 105 possessions per 48 minutes. The fastest teams – Memphis, Indiana, Atlanta, Washington – operated in the 102-105 band. The slowest – Boston at 96.45, Cleveland, Denver, Miami – sat at 96-98. Most of the league clustered 99-101.
The interaction effect: when two teams of different pace play each other, the resulting pace lands closer to the average of the two teams, not the faster team’s pace. A 104-pace team playing a 97-pace team produces a roughly 100-pace game. The slow team’s defensive structure (positional play, half-court emphasis, intentional pace control) drags the joint pace toward the slower side; the fast team can only push so much against a properly structured defensive shell.
What this means for totals: a fast team’s home total is structurally inflated when they play a fellow fast team and deflated when they play a slow team. If Memphis is averaging 245 in home games and they’re hosting Boston, the expected total should be 12-15 points below the season-average home Memphis total because Boston’s pace pulls it down. Books mostly price this, but they occasionally under-adjust on smaller matchups where the modeller hasn’t given the slow team’s pace impact enough weight.
The extreme matchups – Memphis at home against Indiana, both fast – produce the highest pre-game pace projections and the highest totals on the slate (often 240-250). The opposite extreme – Boston at home against Miami – produces the lowest, often 210-218. These are the cleanest matchups to model because pace expectation is unambiguous. The murkier games are the 100-pace teams playing each other, where pace is at baseline and the total depends almost entirely on efficiency projection.
Pace Differential as a Spread Signal
Pace differential – the gap between two teams’ season-average paces – affects more than just totals. It shapes spread movement and player prop expectations in ways most UK punters don’t model.
The dynamic: when a fast team plays a slow team and the joint pace lands near the slow team’s pace, the fast team is operating below their preferred efficiency level. Their offensive rating typically drops 1-2 points per 100 possessions versus their season average, because their transition opportunities are reduced. Meanwhile, the slow team operates at their preferred pace and maintains or slightly improves their efficiency.
The implication: in fast-versus-slow matchups, the slow team gets a small structural advantage that doesn’t show up in straightforward power-rating analysis. Books mostly price this correctly on spread, but the magnitude varies. A slow-pace home team’s spread against a fast-pace road team often opens 1-1.5 points more favourably than a power-rating-pure model would suggest, because the slow team is the structural beneficiary of the joint pace landing in their preferred zone.
Pace differential also affects individual player props. A high-usage star on the fast team going on the road against a slow team faces compressed possessions – his expected scoring drops 5-8% from his season average. The prop line should reflect this; sometimes it does, sometimes it lags. The lag is where the edge sits.
The cleanest pace-differential play I’ve found: betting Under on team total props for the faster team in a fast-vs-slow matchup. The market gives the fast team most of its usual offensive line, but the slow team’s pace control reduces the actual scoring opportunity. The Under has cashed in roughly 56-58% of these specific spots across the samples I’ve tracked, against the implied breakeven of 52-53% at standard prop pricing.
The Three-Point Relationship That Reshaped Pace
The single most important secondary pace signal is the league’s three-point attempt rate. In 1983, NBA teams averaged 2.4 three-point attempts per game. In 2025, they averaged 37.6 – a 15-fold increase across four decades. The correlation between rising three-point volume and falling home court advantage is one of the strongest signals in modern basketball, running at r = -0.88 across the 1983-to-2025 window.
The mechanism: three-point shooting is high-variance. A team can shoot 11-of-22 from three (33 points) on a Tuesday and 6-of-22 (18 points) on a Thursday with the same lineup. That variance compresses the home team’s structural advantage because the away team can have a hot shooting night that wipes out the home crowd’s energy edge. Twenty years ago, when three-point attempts were 15-18 per game, home court was worth 4-5 points. Today, with 37.6 attempts per game, home court is worth closer to 2.5-3 points.
How this connects to pace: three-point heavy teams play faster, on average, because they generate more transition opportunities (defensive rebounds off long misses, more pace-up situations). A team that takes 42 threes per game is structurally faster than a team taking 32, even if their possessions-per-game looks similar in raw count, because the shot-quality distribution favours quicker possessions.
The practical implication for UK punters: high-three-point teams produce wider total variance than the bookmaker’s model captures. A 240 total on a Memphis-Atlanta matchup (both top-10 in three-point attempt rate) has more upside variance than a 240 total on a Cleveland-Indiana matchup at the same pace. The book prices the central estimate correctly; what they often miss is the variance asymmetry. Live in-play Overs on high-three-point matchups in the second half are a recurring edge for punters tracking the right teams.
Building Pace Into Your Pre-Game Routine
The workflow I use, simplified for any UK punter starting on NBA totals: pull up team-pace tables before the slate; identify each game’s joint expected pace as roughly the average of the two teams’ season paces; multiply by league-average efficiency (1.13 points per possession) to get an expected total baseline; compare to the book’s posted total. Differences greater than 4-5 points are worth investigating further with efficiency-specific factors (injuries, rest, defensive matchup quality).
The data is freely available – Basketball-Reference, StatMuse, the NBA’s own statistics portal all publish pace tables that update nightly. The work is in the discipline of checking before clicking, not in any proprietary data source. Most UK punters who lose long-term on totals don’t lose because the maths is hard. They lose because they don’t do the maths.
One last habit I drill: never click an NBA total without naming the expected pace of the game out loud. “This is a 102-pace game.” “This is a 97-pace game.” Forcing yourself to articulate the pace estimate makes you check the total against a baseline rather than against your gut. That single discipline shift has saved me more money than any individual angle or system. If you want to extend the pace thinking into how three-point variance specifically reshapes totals and props, my deeper writeup on betting the NBA three-point era at 37.6 attempts per game walks through the attempt curve and variance implications.
Walking Into Tonight’s Slate With the Right Anchor
Pace is not a sexy angle. It doesn’t produce highlight-reel cashes or screenshot-worthy bet slips. What it produces is a foundational lens for reading totals, spreads, and props correctly across an entire season. The 99.4 league average is the spine; team pace extremes are the variation; matchup interaction effects are the texture; three-point variance is the modern wildcard. Internalise all four and the totals market stops feeling like a guessing game and starts behaving like the model-driven problem it actually is – which is exactly what the operator was hoping you’d never figure out.
See also nba betting help for the complete NBA betting guide.
Almost always - but not exactly at the slow team's pace. The joint pace lands somewhere between the two teams' season averages, weighted slightly toward the slow team because defensive pace control is stronger than offensive pace generation. A 96-pace team playing a 104-pace team typically produces a 99-100 pace game, not the exact midpoint of 100. The slow team's structural defence drags the joint pace down by 1-2 possessions from the simple average. This effect is consistent enough to model and rarely fully priced in totals lines. Intentional fouling in the last 30 seconds of a quarter increases possession count without representing genuine game flow. A team trailing by 5 with 25 seconds left will foul to extend the game, generating 2-3 'possessions' that wouldn't otherwise exist. Most pace estimates published by Basketball-Reference and the NBA's official site adjust for these strategic possessions, but some third-party feeds include them, which inflates team pace by 1-2 possessions per game. If your pace numbers seem higher than expected, check whether your source filters out end-of-quarter intentional fouls.Frequently Asked Questions
Does a slow team versus fast team always settle near the slow team's pace?
How does end-of-quarter intentional fouling skew an NBA pace estimate?
