
Betting the NBA Three-Point Era: 37.6 Attempts per Game and Rising Variance
 Available in US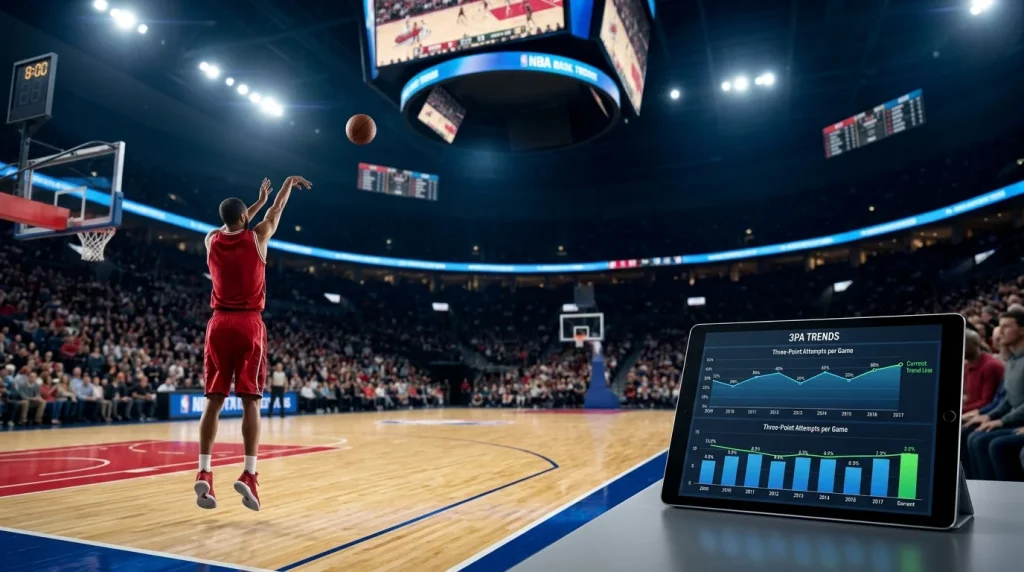
From 2.4 to 37.6 and What It Did to My Spreadsheet
I keep a single line in a spreadsheet that I look at before every game. League three-point attempts per game. In 1983 that number was 2.4. In 2025 it is 37.6. The chart is not a line, it is a launch trajectory. And every betting model I have ever built has had to be rebuilt about every four years to keep up with it.
If you are betting NBA games the way you bet them in 2015, you are betting the wrong sport. The three-point revolution changed pace, it changed variance, it changed home-court advantage, it changed which props are skill markets and which are casino games. Anyone who has not internalised that is leaving money on the table.
See also NBA back-to-back ATS patterns for shooting fatigue angles.
The Attempt Curve from 1983 to Now
The three-point line entered the NBA in 1979. For its first decade, it was a novelty – 2.4 attempts per game in 1983, used mostly at the end of quarters. Then Don Nelson, then Phoenix, then Mike D’Antoni’s Suns, then the Warriors, then everyone. The curve bent upward in the early 1990s and never stopped.
By 2015, the league average had reached 22.4 attempts per game. By 2020, it crossed 30. The 2024-25 season closed at 37.6 – a 1,467 percent increase from the early 1980s. That is not a trend. That is a sport that has structurally changed what scoring looks like. And every line on the betting board, from totals to spreads to player props, has had to absorb that change.
The pace and three-point increase have not happened in isolation. The league played at 99.4 possessions per 48 minutes last year. Slow teams like Boston ran 96.45. Faster teams pushed past 102. More possessions, more attempts, more threes per possession – three multipliers stacked on top of each other. The total points line, which sat around 200 in 2003, now opens between 225 and 240 routinely.
How Higher Volume Killed Home-Court Advantage
One of the cleanest correlations in NBA data is the relationship between three-point attempts and home-court advantage. The correlation coefficient between rising 3PA and falling home win percentage is -0.88. That is an exceptionally tight relationship for a sport with this much variance. Home win rate in 1983 was 68 percent. In 2024-25 it sat at 54.4 percent.
The mechanism is straightforward. Three-point shooting is less affected by crowd energy and arena familiarity than other parts of the game. A free throw, a rim attack, a help-defence rotation – all of these are influenced by the home environment. A catch-and-shoot three from 24 feet, with feet set and rhythm grooved, is the most context-independent shot in basketball. The more of the game runs through three-point shooting, the less the home court matters.
For the UK punter, this means home-side spread shading from a decade ago no longer applies. The books have mostly corrected, but not entirely. Particular subsets – bad home teams with high three-point reliance on the road – still get priced as if their home edge will hold up. Adam Silver, talking about the league’s global appeal in February 2026, captured the shift in a different way: Real Madrid will continue to be Real Madrid, but the basketball fans may say, we want to be part of the relaunched club here in Madrid.
The point being that fan attachment and crowd advantage are increasingly separable from on-court outcome.
Variance and the Total Points Line
More threes does not mean higher scoring in a clean linear way. It means more variance. A three is worth 1.5 times what a two is worth, but it goes in roughly half as often on contested attempts. The expected value math actually favours the three at modern hit rates, but the dispersion around the expected value is wider.
What this means for the total points bet is that the same matchup, run a thousand times, would produce a wider spread of final totals in 2025 than in 2005. The variance is real, the line knows it, and the over-under shading has gone up – not down – to reflect it. UK books typically price NBA totals with around 11 points of vig-adjusted spread now, where it was closer to 7 in the early 2000s.
The practical implication: live betting NBA totals has more swing per quarter than ever. A team that goes 7-of-15 from three in the first half is on pace for a total at the top end of the line range. The same team going 4-of-15 is on pace for the bottom end. Half-time live totals are some of the most active markets at UK in-play windows because of exactly this volatility.
Player Props in the Volume Era
The shift to threes has rewritten the player prop market completely. Five years ago, the standard scoring prop was points, with assists and rebounds as secondary plays. Now three-point makes is a prop offered on essentially every guard and most wings. Bet365 offers 140-plus markets per game; many of the additions over the past few seasons have been three-point variants.
For prop betting, the higher volume cuts both ways. The expected value floor is higher – a guard taking ten threes per game has a baseline number of makes that is harder to fall short of. The ceiling is also higher, but the variance around the median is wider. The result is that the over-under midpoint sits where it should, but the realised outcome scatters further from it. Skill in this market is reading which players are riding hot shooting variance versus which are sustainable.
The defensive read matters more now too. Teams that funnel opponents to threes give up makes in clusters. Teams that hard-close the line force the ball inside. The match-up between a high-volume shooter and a perimeter-strong defence used to be a small edge on the prop. Now it is a 1.5 to 2 make swing in expected value. The UK books that price prop lines off composite averages, without adjusting heavily for defence, leave money on the table.
The Playoff 3PA Shift That Bettors Miss
One of the most consistent edges I have found in recent years is the regular-season-to-playoff three-point attempt shift. The league average attempts drop modestly in the playoffs – usually by 1 to 2 per team – but the distribution changes more sharply. Top contenders attempt about the same or more. Bottom-seed teams cut back, often by 4 or 5 per game.
Why? In the regular season, the eighth seed shoots high-volume threes because that is how they generate scoring. In the playoffs, against a top defence, those shots are contested earlier and harder. The team adjusts toward more rim attacks and mid-range looks – both lower-variance, but also lower-expected-value. The result is that underdog playoff totals lean Under more reliably than regular-season underdog totals.
The Wang 2024 research on pre-fourth-quarter game state showed that 19 percent of games sit within 10 points heading into the final 12 minutes. In those close playoff games, pace drops to that 90 to 100 range and shooting efficiency falls. Fewer threes, lower makes per game, lower team totals than the line typically prices. Under on contested playoff totals in close fourth quarters is one of the cleanest closing-window plays in the calendar.
The 3PA Filter I Run Before Every Bet
Before any total, spread or three-point prop, I run a quick filter. Both teams’ three-point attempt rate over the last ten games. Defensive three-point attempts allowed per game. Pace differential. If the matchup projects toward a high-three-volume game in a high-pace environment, the total should sit above the line midpoint. If the matchup is low-three or high-three with strong perimeter defence, the total leans Under.
This is not a model, it is a sanity check. It catches the games where the line was set on team season averages without adjusting for recent shooting form or the specific defensive matchup. Those mismatches are where the value sits – and they are far more common in the volume era than they were in the 2000s.
The pacing layer is inseparable from this – if you are reading the three-point volume correctly but ignoring possessions, you are halfway home. The breakdown of how pace and possessions feed total points lines covers the other half of the calculation, and the two pieces together are the foundation of any modern NBA totals model.
The shooting revolution is not finished. The 2025-26 numbers will keep climbing. The punter who treats 37.6 attempts as the new normal, and prices everything off it, is ahead of the books on the next adjustment.
See also nba betting help for the complete NBA betting guide.
It pushes them up but not in a one-to-one ratio with attempts. Books factor in expected makes, defensive context and pace simultaneously. A team adding three attempts per game might lift the team total line by one and a half to two points, not the full nine that the raw math would suggest. The reason is variance - more threes means wider distribution, and the line is set at the median, not the mean of the expected outcome. The public bets the recent narrative - a player went 6-of-10 from three last game, so they back the over on three-point makes tonight. That bet is paying for the previous variance. Sharp money prices the expected hit rate, not the recent realised hit rate, and sells overheated lines back to the public. The gap between expected and realised over short samples is wider in the three-point era than ever, which means the public's tendency to extrapolate recent performance is more punishing than it used to be.Frequently Asked Questions
Does higher three-point volume reliably push NBA total points lines up?
Why does three-point variance hurt the public more than sharp money?
